Engagement rate calculator
Paste your own numbers — followers, likes, comments, shares — and get your engagement rate by followers and by views, benchmarked, with a PDF report you can attach to brand pitches.
How it works
- Pick your platform and paste totals from your last 10 posts — your analytics screen has all four numbers. Nothing is uploaded.
- See your engagement rate two ways: by followers (what brands ask for) and by views (what actually reflects short-video reach).
- Download the benchmark report as a PDF, or email it to yourself to attach to your next pitch.
How do I calculate my engagement rate?
The standard formula brands use is total engagements divided by followers, expressed as a percentage. Count likes, comments, and shares or saves across your recent posts — most marketers average the last 10 — then divide by your follower count:
- Add up likes + comments + shares/saves across your last 10 posts.
- Divide by 10 to get average engagements per post.
- Divide that by your follower count and multiply by 100 — that's your engagement rate by followers.
What is a good engagement rate in 2026?
It depends on platform and follower size — smaller accounts naturally run higher. The rule-of-thumb bands creators and agencies commonly work with: on Instagram, 1–3% is typical and above 5% is excellent; on TikTok, 3–6% is typical and above 10% is excellent. Treat these as conversation anchors, not lab values — niches differ widely.
| Platform | Below typical | Typical | Strong | Excellent |
|---|---|---|---|---|
| <1% | 1–3% | 3–5% | 5%+ | |
| TikTok | <3% | 3–6% | 6–10% | 10%+ |
| YouTube | <2% | 2–4% | 4–8% | 8%+ |
Should I measure engagement by followers or by views?
Both, and they answer different questions. By-followers is the number brands traditionally ask for and works for feed platforms. By-views reflects reality on TikTok and Reels, where distribution doesn't depend on followers — a video can do ten times your follower count in views. This calculator gives you both so you can lead with whichever tells your story better.
Why do brands care about engagement rate more than followers?
Because followers can be bought or stale, and engagement can't fake at scale. An account with 10,000 followers at 8% engagement reliably moves more product than 100,000 followers at 0.5% — and sponsors price accordingly. A clean engagement report in your pitch shows you know this, which itself signals you're professional to work with.
How is this different from Phlanx or HypeAuditor?
Those tools analyze a public account by handle — and use the lookup to capture the brand's or your email into their sales funnel. This calculator works from numbers you paste, so it works on any platform, includes saves and shares that public scrapes miss, runs without any signup, and your stats never leave your browser.
Frequently asked questions
Is this engagement rate calculator free?
Yes — free, no signup, no watermark on the PDF report. Asobi Tools runs entirely in your browser, so there's no server cost and no reason to gate it.
Do you see my stats or store them?
No. The math runs on your device and your numbers never leave your browser. If you email yourself the report, that one PDF is sent and nothing is kept.
Which posts should I count?
Your last 10 posts is the convention most agencies use — recent enough to reflect your current content, large enough to smooth out one viral or dead post. If you post daily, the last 2 weeks works the same way.
Do saves count as engagement?
Yes — on Instagram and TikTok, saves are among the strongest signals and any modern engagement calculation includes them. Add saves and shares together in the shares field; that matches how analytics dashboards group them.
What's the formula for engagement rate by views?
Total engagements divided by total views, times 100. It's the fairer measure for TikTok, Reels, and Shorts, where most viewers aren't followers. By-views rates look lower — 4–8% engagement-per-view is healthy short-video territory.
Is the benchmark table accurate for my niche?
The bands are cross-industry rules of thumb — useful anchors, not absolutes. Niches with tight communities (art, fitness coaching, niche tech) run hotter than broad entertainment. Use the bands for direction and your own trend over time as the real signal.
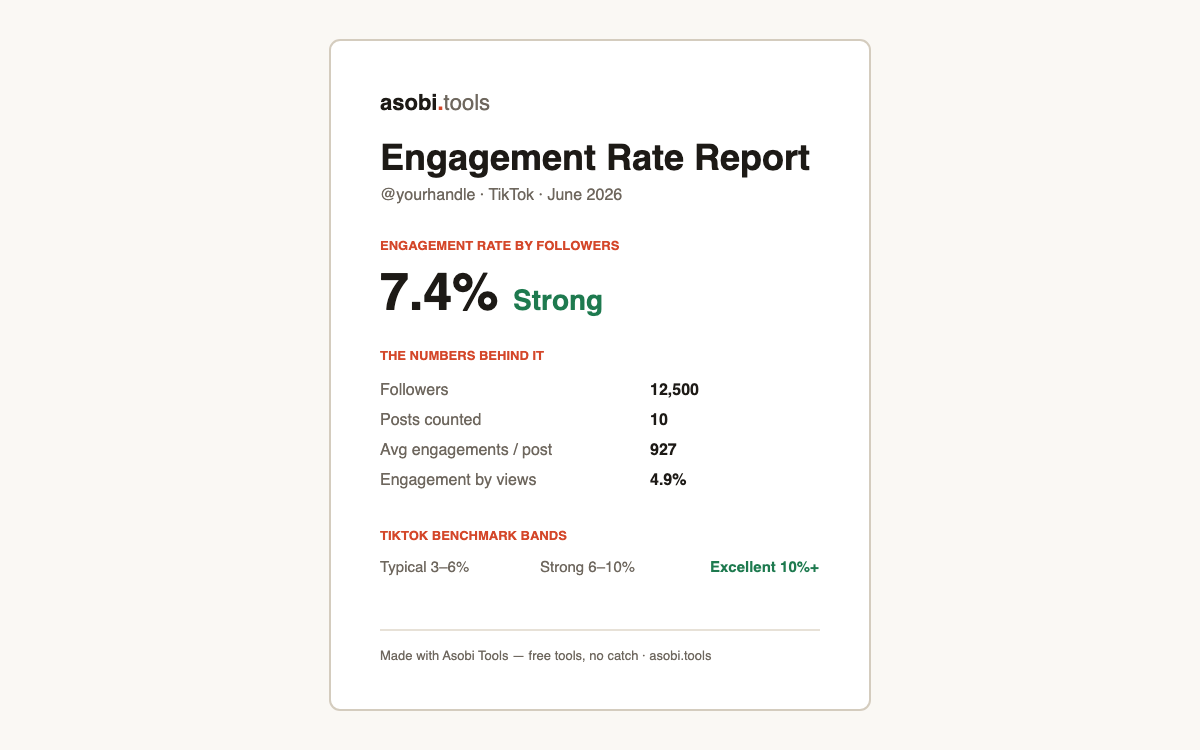
Can I use the report in a brand pitch?
That's exactly what it's for. The PDF shows your handle, platform, per-post averages, both engagement rates, and where you land against the benchmark bands — a clean attachment for your pitch email or media kit. Pair it with the Asobi Tools media kit generator for the full package.
Does this work for small accounts?
Yes, and small accounts often have the best story to tell — engagement rate is the one metric where a 5,000-follower account can beat a celebrity. If you're pitching as a nano or micro influencer, your engagement rate is your headline number.
Who built this?
Asobi Tools is built by Asobi Labs, an independent Brooklyn studio run by a working creator. Every tool is free, signup-less, and runs in your browser — your data never leaves your device.